S&P500 Daily Action Areas & Price Targets 15/6/26
S&P500 Daily Action Areas & Price Targets 15/6/26
***QUOTING ES1! FOR CASH US500 EQUIVALENT LEVELS, SUBTRACT POINT DIFFERENCE***
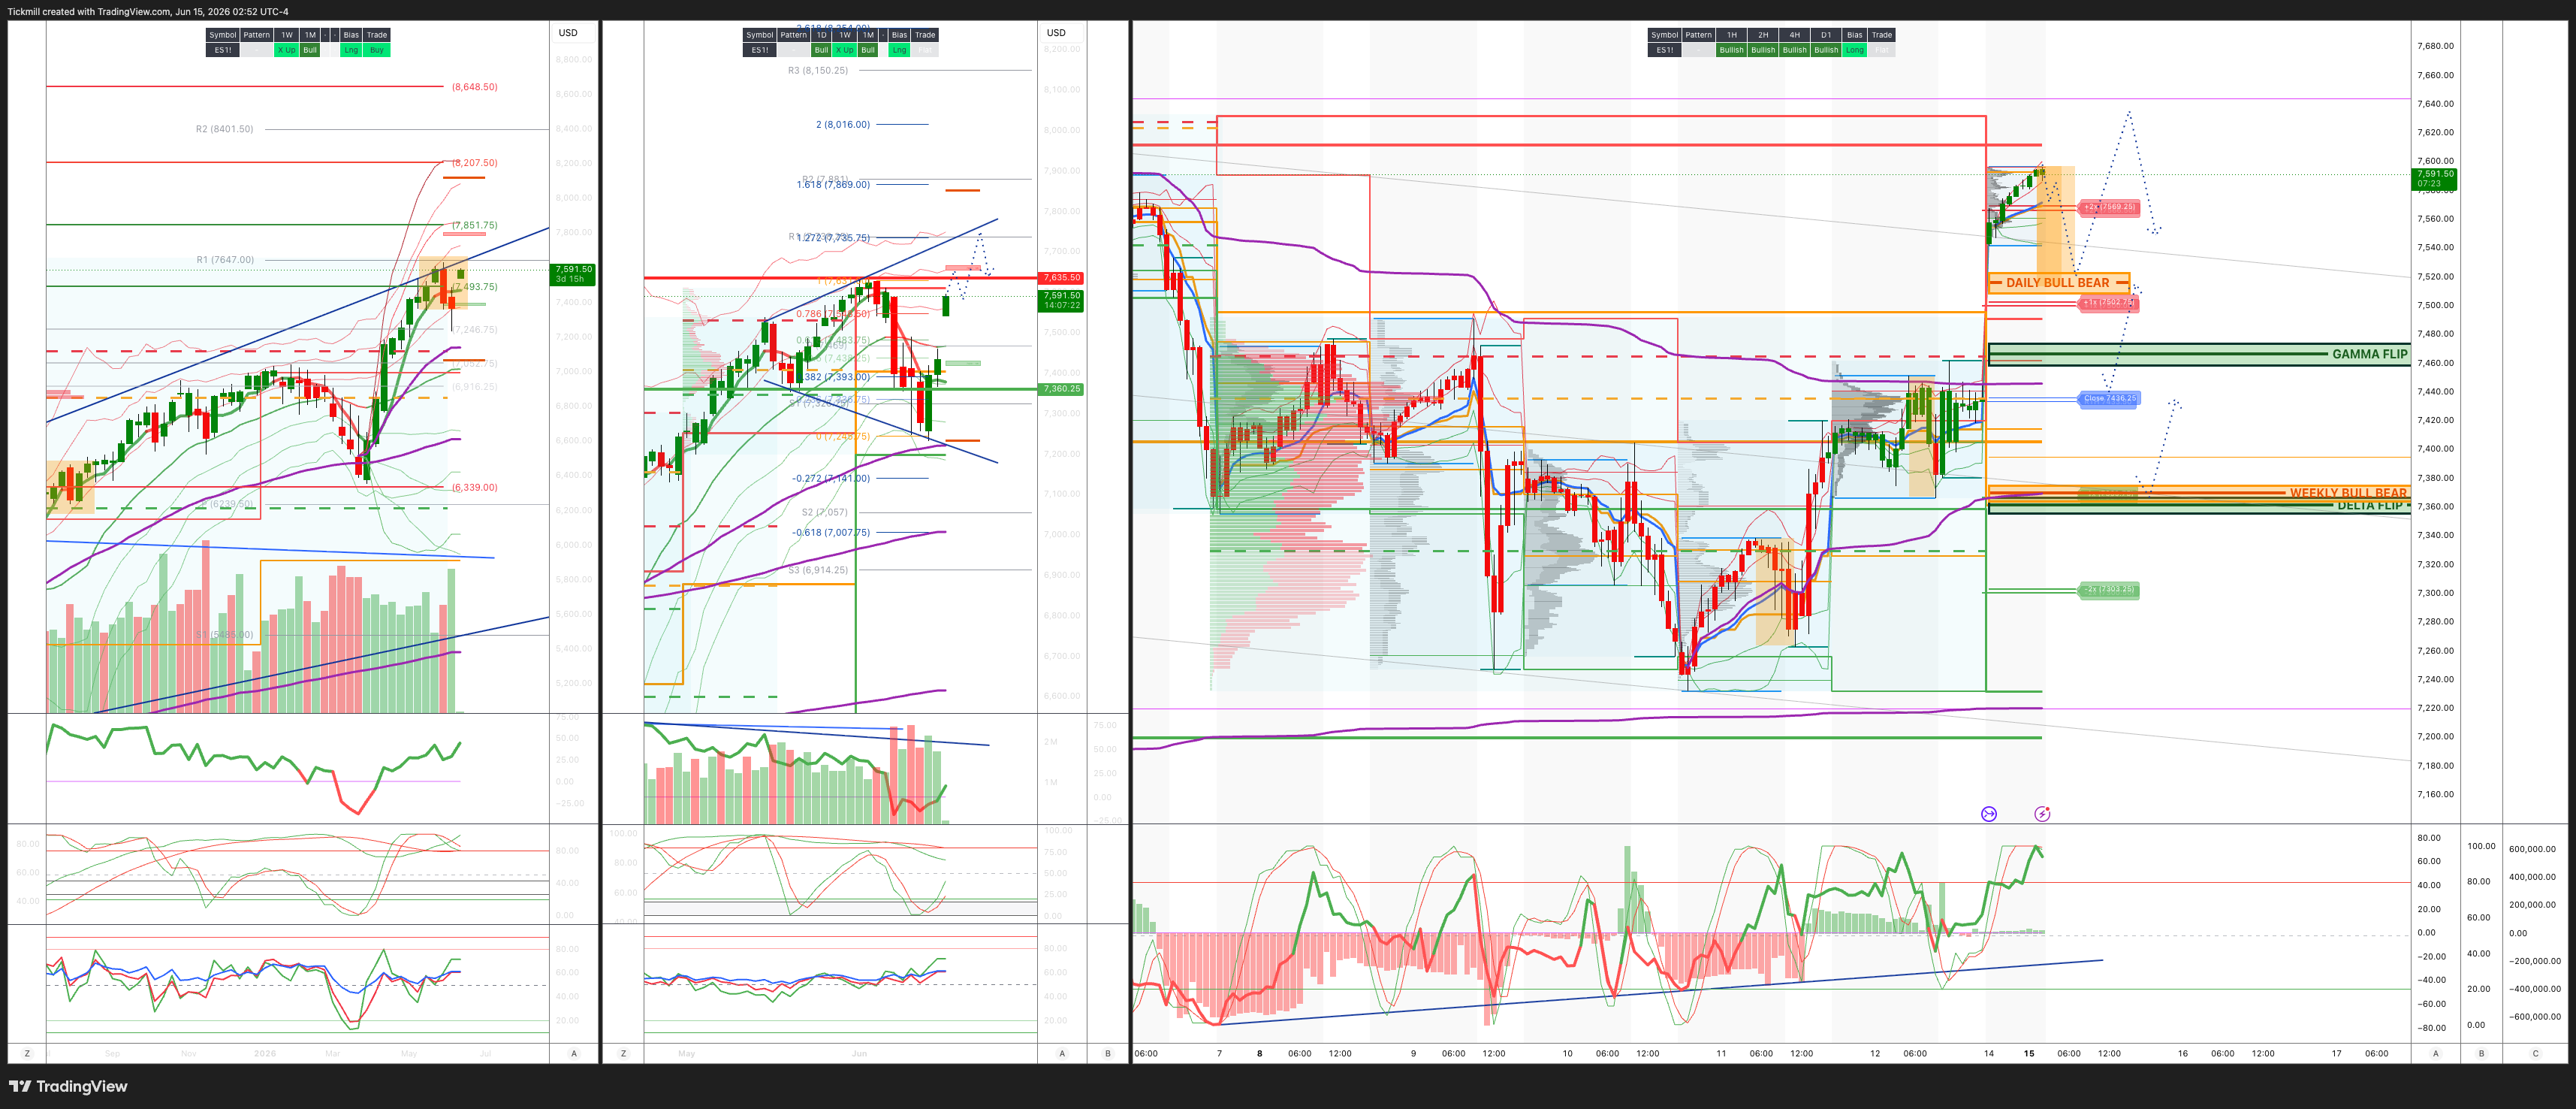
WEEKLY BULL BEAR ZONE 7365/75
WEEKLY RANGE RES 7635 SUP 7360
June MOPEX Straddle: 274pt range implies a OPEX to OPEX range of [7134, 7683]
June QOPEX Straddle is 546.4pt giving us a range of [5960,7052]
JHEQX Q2 Collar 6189/6290 - 6865/6955
DEC2025 OPEX to DEC2026 OPEX is 945 points giving us a range of [5889,7779]
SPX PUT/CALL RATIO 1.06 (The numbers reflect options traded during the current session. A put-call ratio below 0.7 is generally considered bullish, and a put-call ratio above 1.0 is generally considered bearish)
DAILY VWAP BULLISH 7380
WEEKLY VWAP BEARISH 7474
MONTHLY VWAP BULLISH 7036
DAILY STRUCTURE - OTFH - 7491
WEEKLY STRUCTURE - OTFL - 7491
MONTHLY STRUCTURE - OTFH - 7199
Balance: This refers to a market condition where prices move within a defined range, reflecting uncertainty as participants await further market-generated information. Our approach to balance includes favouring fade trades at the range extremes (highs/lows) while preparing for potential breakout scenarios if the balance shifts.
One-Time Framing Higher (OTFH): This represents a market trend where each successive bar forms a higher low, signalling a strong and consistent upward movement.
One-Time Framing Lower (OTFL): This describes a market trend where each successive bar forms a lower high, indicating a pronounced and steady downward movement.
DAILY BULL BEAR ZONE 7340/30
GAMMA FLIP 7468
DELTA FLIP 7360
DAILY RANGE RES 7566 SUP 7428
2 SIGMA RES 7634 SUP 7360
VIX BULL BEAR ZONE 19
TRADES & TARGETS
LONG ON REJECT/RECLAIM DAILY BULL BEAR ZONE TARGET DAILY RANGE RES
***ADDITIONAL SETUPS & TARGETS HIGHLIGHTED ON THE CHARTS***
(I FADE TESTS OF 2 SIGMA LEVELS ESPECIALLY INTO THE FINAL HOUR OF THE NY CASH SESSION AS 90% OF THE TIME WHEN TESTED THE MARKET WILL CLOSE ABOVE OR BELOW THESE LEVELS)
GOLDMAN SACHS TRADING DESK VIEW - ‘Macro Short Covering’
Macro short covers set the early tone for summer 2026. The market is not showing clean directional conviction, with AAII bulls at one-year lows and the S&P essentially flat over the past month, but crowded one-delta hedges have started to come off. That creates a choppy but tradable backdrop: investors are under-confident, indices are directionless, and positioning is being reshuffled under the surface. The “broadening out” trade remains the dominant desk conversation, as participants look for the next opportunity outside the most crowded Mega-Cap Tech and AI winners.
The Fed setup is unusually consequential because Warsh is walking into his first FOMC meeting with conflicting data. CPI is running at 4.2%, but core is relatively soft. PPI is running at 6.5% annually, the highest since 2022. Payrolls printed 172k, with the three-month average at 188k. Consensus views a hold as a foregone conclusion, but in isolation several of these data points look more like hike data than easing data. The decision itself is likely not the event; the press conference is the event.
The key risk is that the same rate decision can produce very different market outcomes depending on how Warsh frames the inflation problem. If the Fed holds but signals tightening bias, with one hike already priced for January 2027, front-end rates could sell off and 2-year SOFR could cheapen meaningfully. That would likely pressure long-duration equities, Tech, and crowded AI exposures. If instead the Fed holds and emphasizes that supply-driven inflation cannot be solved with demand-side tools, the front end could rally, financial conditions could ease, and equities could catch a bid. Same hold, different press conference, very different path for SPX.
This is why FOMC-day 0DTE theta is so interesting. The market is likely to enter the event with a binary-looking rates reaction function but without a true binary policy decision. The optionality sits in the communication, not the rate move. If Warsh validates hike risk, the market has to reprice the front end and potentially re-pressure Mega-Cap Growth. If he leans into patience and supply-side inflation logic, the market may treat it as permission to extend the broadening rally and squeeze high-beta hedges further.
The GS rates framing of “no cuts this year” and “a higher floor” fits the macro regime. Even if the Fed does not hike, the hurdle for cuts is high because growth is durable, payrolls are firm, inflation is still above target, and fiscal/capex impulses remain hot. This argues for a higher equilibrium level of rates and a front end that remains sensitive to hawkish communication. For equities, the implication is not necessarily bearish, but it does mean multiple expansion in long-duration growth is harder to sustain unless earnings and AI capex revisions continue doing the heavy lifting.
After one of the worst weeks for Mag 7 versus the market in years, there is a tactical case to buy delta or calls in the Mega-Cap Tech basket for a rebound. This is not necessarily a structural re-concentration call; it is a mean-reversion trade after a violent relative drawdown. The prior week saw TMT supply from both long-only investors and hedge funds, but when positioning and performance get stretched to the downside over a short window, tactical call exposure can make sense, especially if FOMC communication and rates are not aggressively hawkish.
Gold is another interesting setup. It is down roughly 25% from January highs but still up about 25% over the past 52 weeks. It had meme-like activity earlier in the year and has since deflated, but the GS futures team now sees the world as short gold across CTAs, ETFs, and futures. GLD call skew is near decade lows. That creates a favorable options setup: either long-delta risk reversals, selling puts to buy calls, or ratio call spreads such as selling one call and buying three further-out calls. An Iran resolution could serve as a clearing event after months of underperformance, especially if shorts have to cover into any renewed bid.
The prime brokerage data show that hedge funds have bought US equity risk for four straight weeks, but the latest week was not primarily about increasing alpha exposure. It was more about decreasing beta shorts. The global prime book was net bought, with short covering exceeding long buying by 4.7 to 1. That is a critical distinction. The market can rally on short-covering, but short-covering is a less durable source of demand than fresh long accumulation. It supports the idea of a tradable squeeze, not necessarily a clean new leg higher in fundamentals-led risk appetite.
Despite the overall prime book being bought, single stocks were actually net sold. Nine of eleven sectors were net sold, led in dollar terms by Info Tech, Communication Services, Staples, and Discretionary. Financials, for the third week in a row, and Industrials were net bought. This reinforces the broadening story, but with an important nuance: investors are not broadly adding single-name risk. They are reducing shorts and reallocating toward select cyclicals and financials while continuing to sell crowded TMT exposure.
The cash one-delta desk saw Mega-Cap Tech underperform the S&P by more than 400bps during the week, with continued supply in TMT from both long-only investors and hedge funds. Under the hood, however, the broadening dynamic continues from both a “make room” and “reduce concentration” standpoint. Investors are creating room for non-Tech exposure by trimming crowded winners, and they are reducing portfolio concentration after a period when index returns were heavily tied to a narrow set of AI and Mega-Cap names. The earlier RSP versus SPX outperformance option pitch has already worked, with RSP outperforming by 2.4% versus an ATM outperformance call cost of 1.4%.
On volatility, short-dated SPX gamma continues to perform well for those willing to actively trade the delta. The desk likes owning short-dated vol because the spread between implied and realized volatility is near one of the lowest levels of the past two years. Top-of-book liquidity is extremely low, which tends to coincide with higher realized volatility. This is the core microstructure argument for owning gamma: even if the index is flat over a month, intraday ranges and gap risk can make convexity valuable.
Single-stock volatility remains expensive versus index volatility, but it continues to work. The cost of convexity in single names versus the index remains at all-time wides, with the average S&P name trading at more than 2x the implied volatility of the index in six-month tenor. That is a high cost of admission, but dispersion has been large enough that owning single-name vol has still been a good trade. The collar trade is also gaining attention in stocks where call skew is inverted, allowing investors to finance downside protection in a more attractive way.
The NDX versus SPX volatility spread is one of the clearest expressions of the market’s current stress. NDX one-month ATM vol now trades around 1.6x SPX, near a 15-year high. On a post-2001 timeframe, the spread can widen further, so it is not necessarily at an absolute limit. But it clearly shows that investors view Nasdaq risk as very different from broad-market risk. The market is pricing the AI/Mega-Cap unwind as a distinct factor event rather than a uniform equity-market drawdown.
The basket recommendations fit the broadening framework. The team sees catch-up potential in areas where prices have lagged earnings momentum, including memory, infrastructure, and related capex beneficiaries. The broadening trade is expected to continue, with S&P ex-AI and cyclicals favored implementations. The logic is straightforward: earnings momentum outside AI has improved, positioning is lighter, and investors are actively reducing concentration. On the short side, expensive European defensives are vulnerable if the market continues rotating toward cyclicality and earnings momentum rather than bond-proxy defensiveness.
Summer 2026 is beginning with low conviction at the index level but very high opportunity at the factor level. Macro short-covering, weak sentiment, flat index performance, and crowded hedges create room for squeezes, but the Fed press conference is a major path-setter. The market wants to broaden, but it still has to navigate sticky inflation, a higher rates floor, thin liquidity, and extreme Nasdaq-versus-SPX volatility dispersion. The best framework remains active and convex: selectively buy tactical Mag 7 rebound exposure, lean into broadening via S&P ex-AI and cyclicals, consider gold upside structures where skew is cheap, and own gamma in a market where liquidity is poor and realized volatility keeps showing up.
Disclaimer: The material provided is for information purposes only and should not be considered as investment advice. The views, information, or opinions expressed in the text belong solely to the author, and not to the author’s employer, organization, committee or other group or individual or company.
Past performance is not indicative of future results.
High Risk Warning: CFDs are complex instruments and come with a high risk of losing money rapidly due to leverage. 71% and 74% of retail investor accounts lose money when trading CFDs with Tickmill UK Ltd and Tickmill Europe Ltd respectively. You should consider whether you understand how CFDs work and whether you can afford to take the high risk of losing your money.
Futures and Options: Trading futures and options on margin carries a high degree of risk and may result in losses exceeding your initial investment. These products are not suitable for all investors. Ensure you fully understand the risks and take appropriate care to manage your risk.
Patrick has been involved in the financial markets for well over a decade as a self-educated professional trader and money manager. Flitting between the roles of market commentator, analyst and mentor, Patrick has improved the technical skills and psychological stance of literally hundreds of traders – coaching them to become savvy market operators!