Institutional Insights: Goldman Sachs SP500 Positioning & Key Levels 30/6/26

Key Takeaways from the GS Positioning Recap
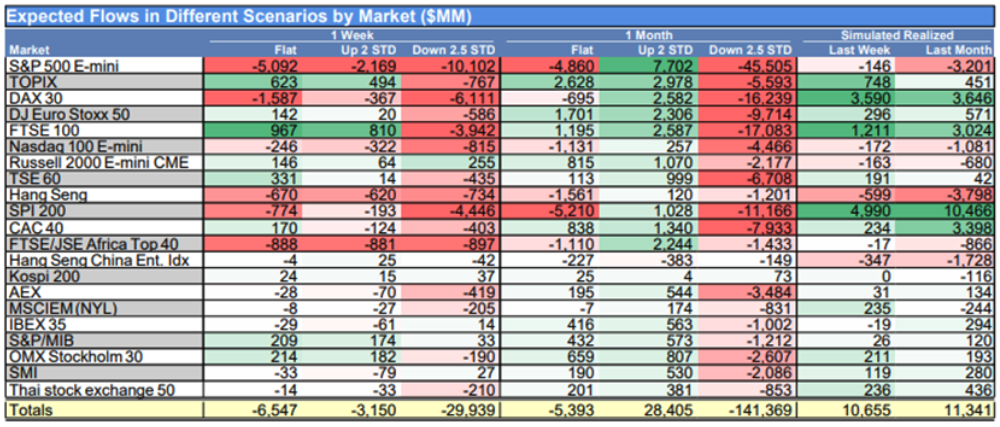
1. CTA positioning: near-term selling bias, but not large unless market falls
Over the next 1 week, CTAs are expected to be net sellers in all market scenarios:
Flat tape: -$6.55B globally, including -$5.19B from the US
Up tape: -$3.15B globally, including -$2.43B from the US
Down tape: -$29.94B globally, including -$10.66B from the US
The near-term flow risk is therefore asymmetric to the downside, but the base-case selling magnitude appears modest.
Over the next 1 month, the picture becomes more directional:
In an up tape, CTAs could turn into buyers of +$28.41B globally.
In a down tape, CTAs could sell heavily: -$141.37B globally, including -$52.15B from the US.
SPX pivot levels:
Short term: 7378
Medium term: 7104
Long term: 6678
2. Prime Brokerage: major de-risking, especially in US Tech
The GS Prime Brokerage data points to a clear reduction in risk across hedge fund books.
Overall leverage
Gross leverage: down 2.1 pts to 313.5%
Still high at the 87th percentile over 1 year.
Net leverage: down 2.1 pts to 80.1%
67th percentile over 1 year.
Overall long/short ratio: down 1.1% to 1.687
Low at the 25th percentile over 1 year.
Fundamental L/S books
Gross leverage: down 7.2 pts to 199.2%
A 1-year low.
Net leverage: down 4.0 pts to 55.2%
37th percentile over 1 year.
US L/S gross leverage fell for a second consecutive week by 5.9 pts, the largest weekly drop since mid-March.
US L/S net leverage fell 2.7 pts, the largest weekly decline in three months.
Interpretation: Fundamental hedge funds are meaningfully cutting exposure, with gross leverage now at a 1-year low.
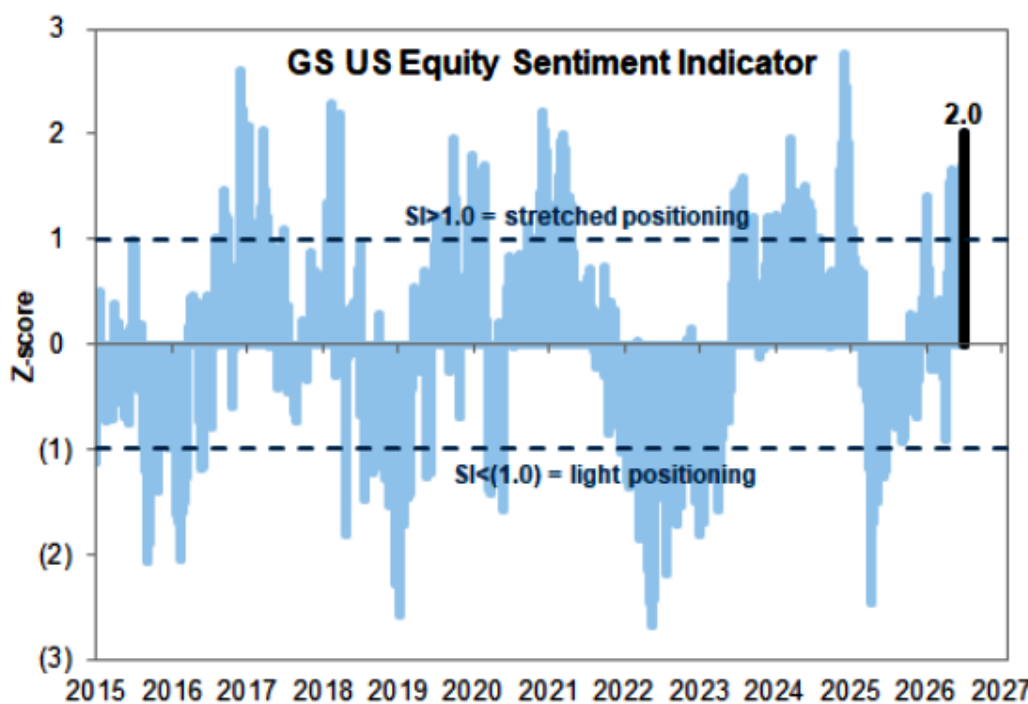
3. Global equities saw the largest net selling in 3 months
Global equities experienced the largest percentage net selling in 3 months, at -2.9 standard deviations versus the past year.
Selling was driven by both:
Short sales
Long sales
The ratio of short to long sales was 1.7 to 1, meaning the selling was more heavily driven by new or increased shorts.
Regional picture
All major regions were net sold.
Selling was led in dollar terms by:
North America
Developed Market Asia
Sector picture
7 of 11 global sectors were net sold.
Most net sold:
Information Technology
Communication Services
Industrials
Most net bought:
Consumer Staples
Utilities
Energy
4. Tech selling was extreme
This was one of the most important points in the recap.
US Information Technology saw the largest net selling in more than 10 years, both in dollar and percentage terms.
The move registered a -4.0 z-score, indicating an unusually large outflow.
Globally, the combined percentage net selling across Info Tech and Communication Services was the largest in more than 10 years.
However, positioning remains mixed:
Despite the selling, Semis & Semi Equipment net exposure remains very elevated:
98th percentile versus the past five years.
This suggests investors reduced exposure, but the sector remains crowded.
5. Mag 7 exposure is approaching multi-year lows
Mag 7 stocks were net sold for a fifth consecutive week.
Gross exposure is now near a 3-year low:
4th percentile
Net exposure is also near a 3-year low:
6th percentile
Interpretation: Hedge funds have materially reduced exposure to the Mag 7 complex, even as semiconductor exposure remains elevated.
6. Buyback support is fading due to blackout windows
Corporate buyback activity remains strong versus prior years but is now contracting week over week.
Current buyback volumes are:
1.5x 2025 YTD ADTV
1.5x 2024 YTD ADTV
Activity is skewed toward:
Technology
Consumer Discretionary
Financials
However:
Around 88% of corporates are now estimated to be in blackout ahead of Q2 earnings.
The blackout window is expected to run through the end of July.
Most current activity is coming from 10b5-1 plans, which represent roughly 75% of total desk buyback flows.
Interpretation: A key source of equity demand is weakening seasonally, reducing a major support for the market into earnings season.
Overall Read-Through
The positioning backdrop looks more fragile than outright bearish.
Constructive points
CTA selling over the next week is expected to be modest unless the market declines.
One-month CTA flows could become positive in an up-tape scenario.
Buybacks remain elevated versus prior years, even though they are now constrained by blackout windows.
Hedge fund performance was positive over the cited period, supported by alpha.
Cautionary points
Prime Brokerage data shows broad de-risking.
Global equities saw the largest net selling in three months.
US Tech selling was extreme, with the largest net selling in more than a decade.
Mag 7 exposures are near multi-year lows.
Buyback support is fading as blackout restrictions broaden.
CTA flow risk becomes meaningfully negative in a down-tape scenario.
Disclaimer: The material provided is for information purposes only and should not be considered as investment advice. The views, information, or opinions expressed in the text belong solely to the author, and not to the author’s employer, organization, committee or other group or individual or company.
Past performance is not indicative of future results.
High Risk Warning: CFDs are complex instruments and come with a high risk of losing money rapidly due to leverage. 71% and 74% of retail investor accounts lose money when trading CFDs with Tickmill UK Ltd and Tickmill Europe Ltd respectively. You should consider whether you understand how CFDs work and whether you can afford to take the high risk of losing your money.
Futures and Options: Trading futures and options on margin carries a high degree of risk and may result in losses exceeding your initial investment. These products are not suitable for all investors. Ensure you fully understand the risks and take appropriate care to manage your risk.
Patrick has been involved in the financial markets for well over a decade as a self-educated professional trader and money manager. Flitting between the roles of market commentator, analyst and mentor, Patrick has improved the technical skills and psychological stance of literally hundreds of traders – coaching them to become savvy market operators!