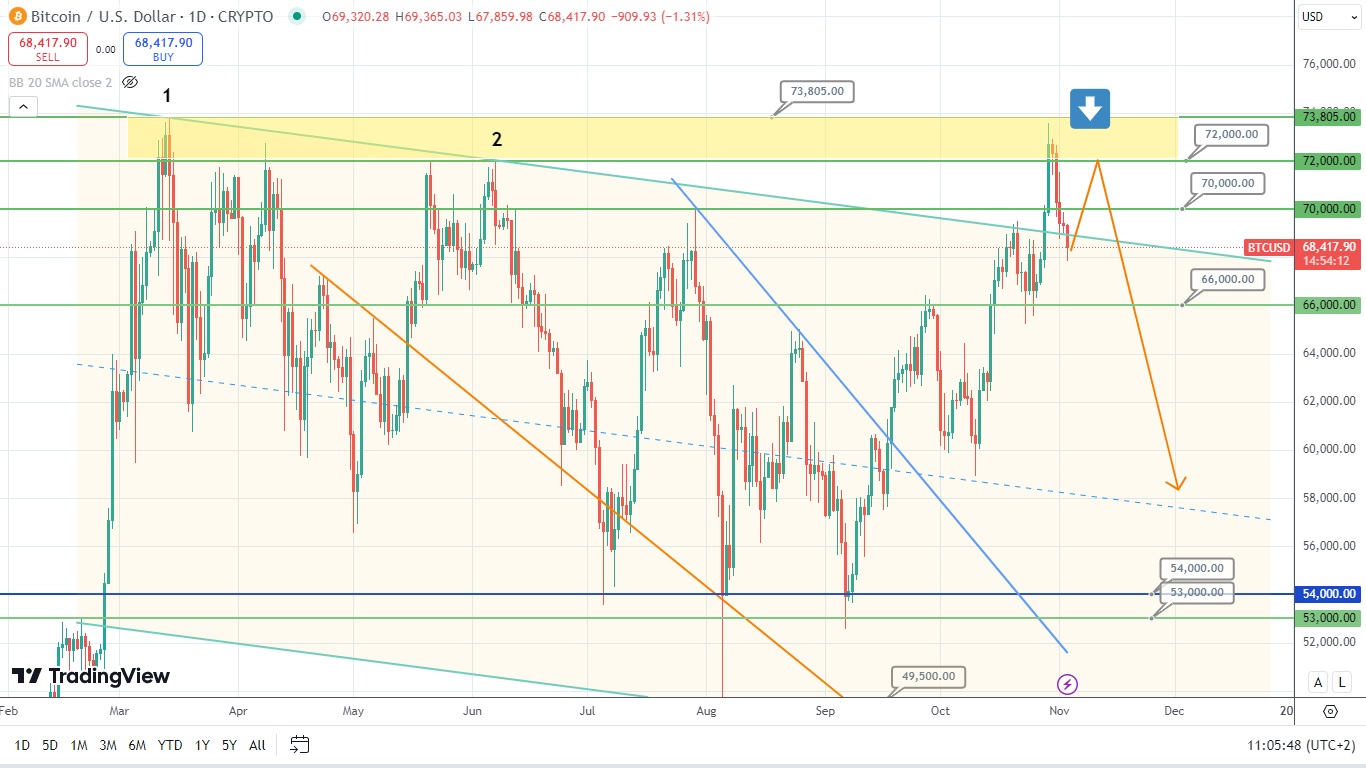
Bitcoin Forecast: Potential Price Drop Ahead
Last week Bitcoin tried to reach the maximum price points, but to no avail. The price of this asset dropped at the end of the trading week. At that, the weekly chart shows the formation of a shooting star. However, as it can be seen from the daily timeframe, the price of Bitcoin might potentially retest the level of 72000, which acts as a bullish trap, and drop. So, let’s observe what the next price movement of this asset might be.
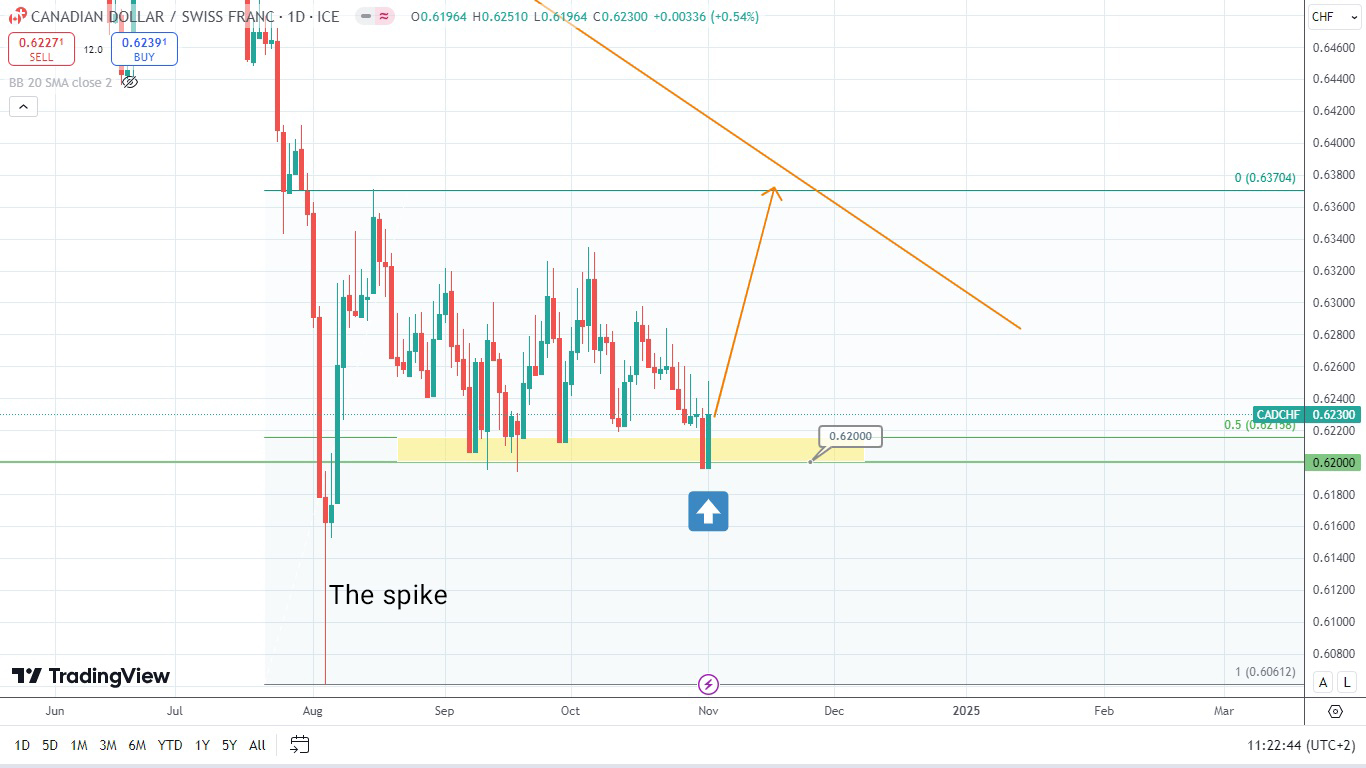
Now, let’s have a look at the current cross rate of the currency pair CAD/CHF. The price of this currency pair has formed a spike with a long shadow at the beginning of August. Currently, the asset’s price is testing the middle point of this reversal pattern. Also, the middle point of this spike almost coincides with the psychological level of 0.6200. At that, it is important to know that the price of this currency pair has formed the bullish engulfing at the end of the last trading week. This signifies the upcoming price growth right at the beginning of the next trading week. The price of this asset won’t rise only if it dives below the level of 0.6190. Time will tell what might happen next.
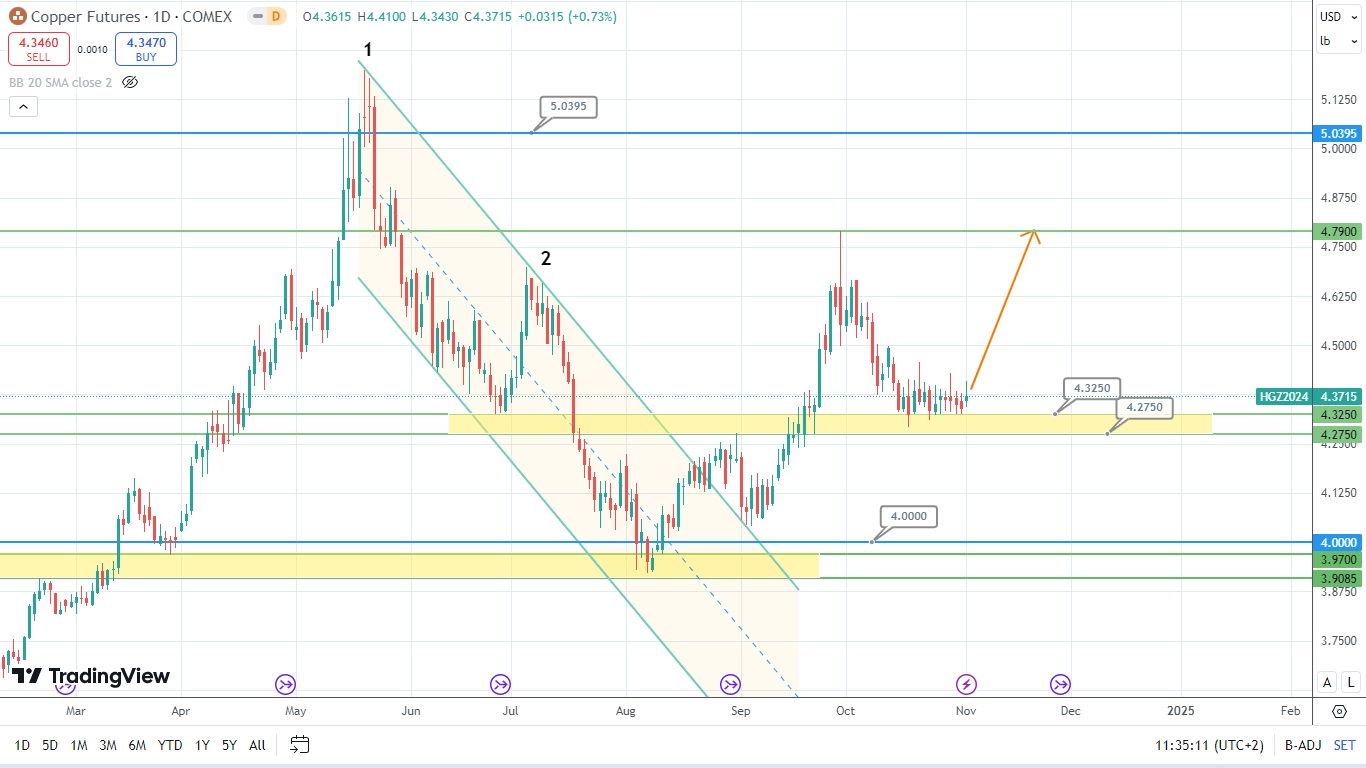
The price of copper remains in the supporting zone formed between levels 4.275 and 4.325 for two weeks in a row. The price of this asset has formed a series of small candlestick patterns. It means that the price of copper might rise at the beginning of the next trading week. It should target the level of 4.7900. However, if the asset’s price breaks the level of 4.2750 through, it is likely to drop and gain the required support at the level of 4.0000.
Disclaimer: The material provided is for information purposes only and should not be considered as investment advice. The views, information, or opinions expressed in the text belong solely to the author, and not to the author’s employer, organization, committee or other group or individual or company.
Past performance is not indicative of future results.
High Risk Warning: CFDs are complex instruments and come with a high risk of losing money rapidly due to leverage. 69% and 73% of retail investor accounts lose money when trading CFDs with Tickmill UK Ltd and Tickmill Europe Ltd respectively. You should consider whether you understand how CFDs work and whether you can afford to take the high risk of losing your money.
Futures and Options: Trading futures and options on margin carries a high degree of risk and may result in losses exceeding your initial investment. These products are not suitable for all investors. Ensure you fully understand the risks and take appropriate care to manage your risk.